
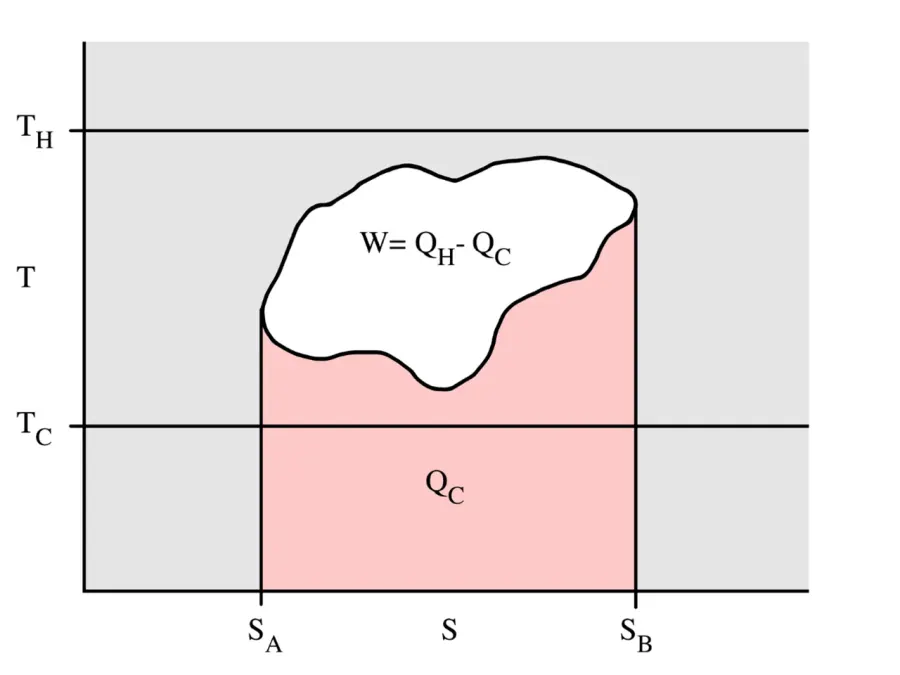
 Temperature–entropy diagram
Common
Rarity: Common
The most frequent rarity: most Wikipedia articles become Commons.
Rarity follows how well known the article is: its views on the French and English Wikipedia over a year, and the number of languages it exists in.
At a glance
- Class
- Notion
- Domain
- Science and technology
- In collections
- Nobody has pulled it yet.
What Wikipedia says
In thermodynamics, a temperature–entropy (T–s) diagram is a thermodynamic diagram used to visualize changes to temperature (T ) and specific entropy (s) during a thermodynamic process or cycle as the graph of a curve.
Excerpt from the Wikipedia article “Temperature–entropy diagram”, under the CC BY-SA 4.0 license. Read the article on Wikipedia
Image: Eric_DUMINIL at English Wikipedia, Public domain, via Wikimedia Commons.
Open free boosters and add Temperature–entropy diagram to your collection.
Play for free