 Area chart
Common
Rarity: Common
The most frequent rarity: most Wikipedia articles become Commons.
Rarity follows how well known the article is: its views on the French and English Wikipedia over a year, and the number of languages it exists in.
At a glance
- Class
- Notion
- Domain
- Science and technology
- In collections
- Nobody has pulled it yet.
What Wikipedia says
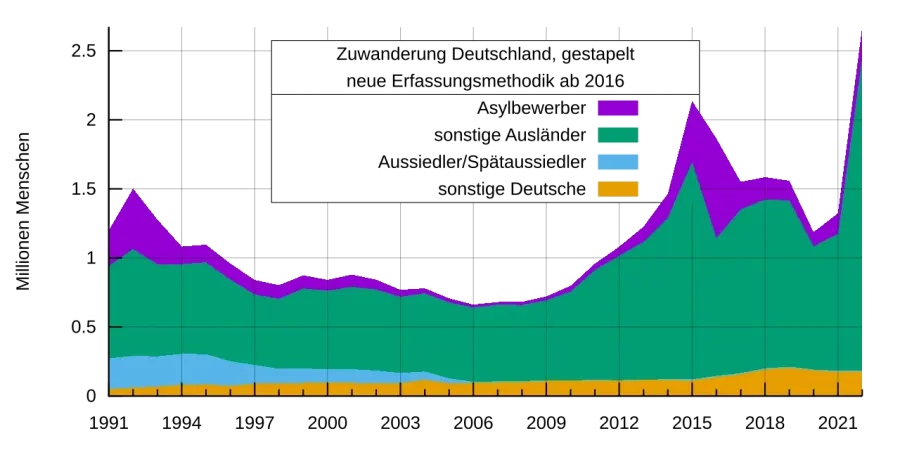
An area chart or area graph displays graphically quantitative data. It is based on the line chart. The area between axis and line are commonly emphasized with colors, textures and hatchings. Commonly one compares two or more quantities with an area chart.
Excerpt from the Wikipedia article “Area chart”, under the CC BY-SA 4.0 license. Read the article on Wikipedia
Image: StefanPohl, Hi, future humans! (talk · contribs), CC0, via Wikimedia Commons.
Open free boosters and add Area chart to your collection.
Play for free