 Ggplot2
Common
Rarity: Common
The most frequent rarity: most Wikipedia articles become Commons.
Rarity follows how well known the article is: its views on the French and English Wikipedia over a year, and the number of languages it exists in.
At a glance
- Class
- Invention
- Domain
- Science and technology
- Knowledge cost
- 2
- In collections
- Nobody has pulled it yet.
What Wikipedia says
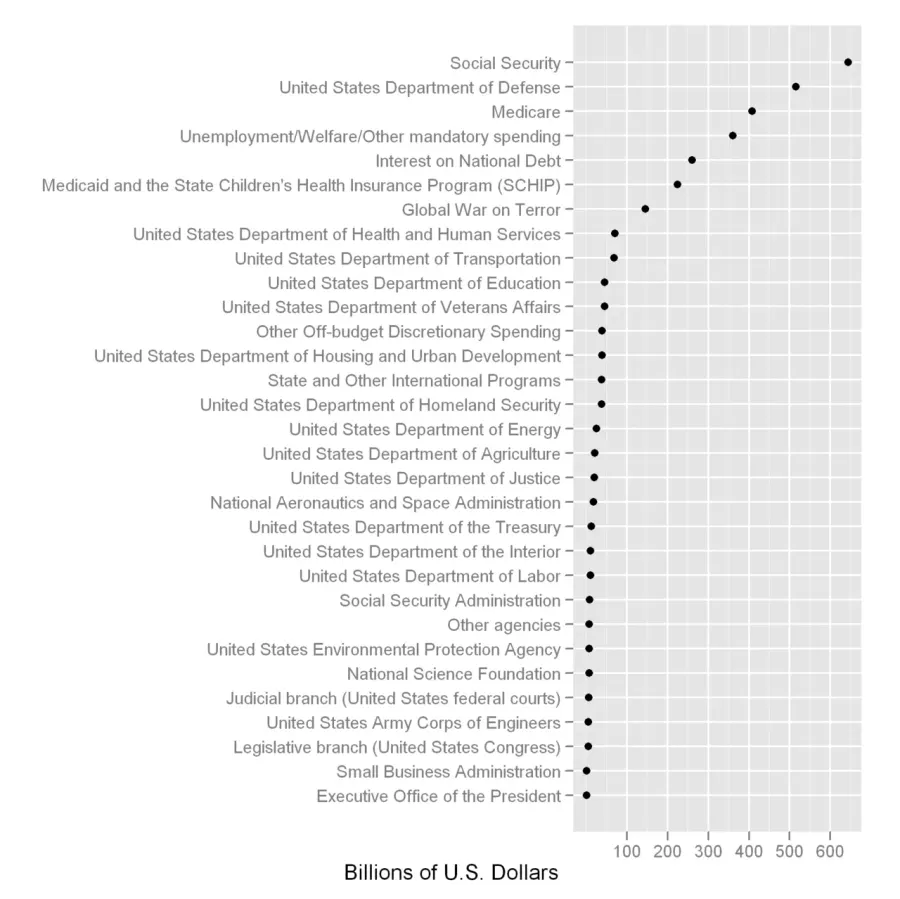
ggplot2 is an open-source data visualization package for the statistical programming language R. Created by Hadley Wickham in 2005, ggplot2 is an implementation of Leland Wilkinson's Grammar of Graphics—a general scheme for data visualization which breaks up graphs into semantic components such as scales and layers. ggplot2 can serve as a replacement for the base graphics in R and contains a number of defaults for web and print display of common scales.
Excerpt from the Wikipedia article “Ggplot2”, under the CC BY-SA 4.0 license. Read the article on Wikipedia
Image: Thopper, CC BY-SA 3.0, via Wikimedia Commons.
Open free boosters and add Ggplot2 to your collection.
Play for free