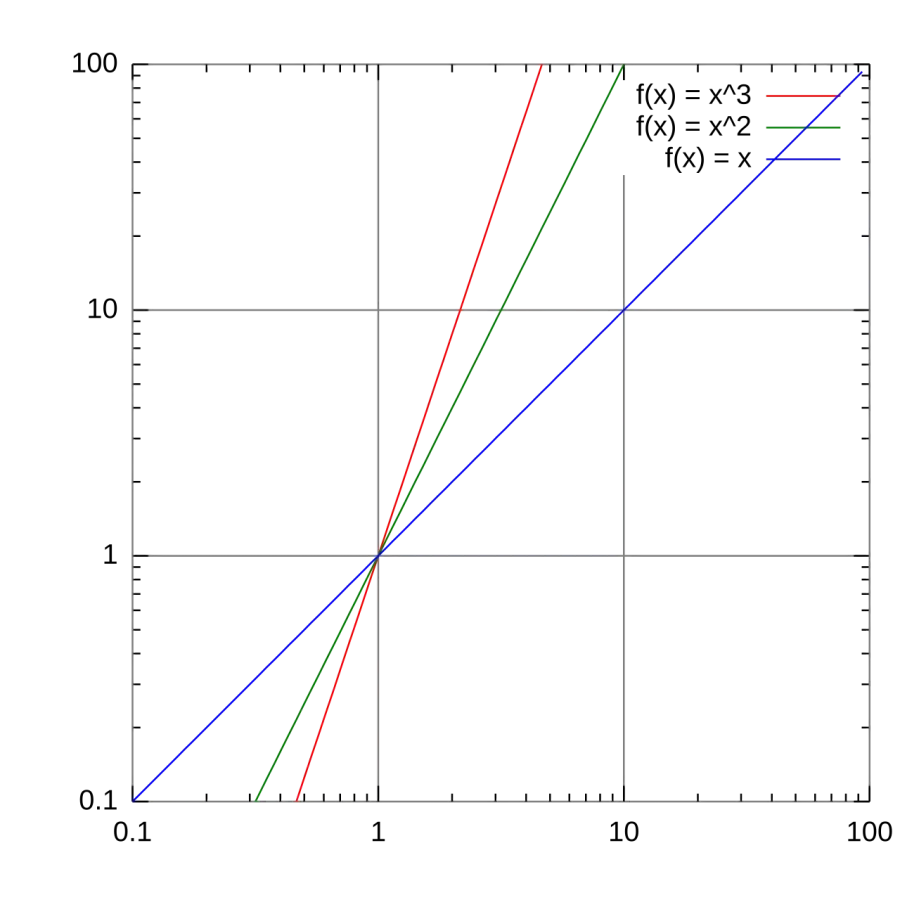
 Log–log plot
Common
Rarity: Common
The most frequent rarity: most Wikipedia articles become Commons.
Rarity follows how well known the article is: its views on the French and English Wikipedia over a year, and the number of languages it exists in.
At a glance
- Class
- Notion
- Domain
- Science and technology
- In collections
- Nobody has pulled it yet.
What Wikipedia says
In science and engineering, a log–log graph or log–log plot is a two-dimensional graph of numerical data that uses logarithmic scales on both the horizontal and vertical axes. Power functions – relationships of the form
Excerpt from the Wikipedia article “Log–log plot”, under the CC BY-SA 4.0 license. Read the article on Wikipedia
Image: Original: Unknown Vector: Autopilot, CC BY-SA 3.0, via Wikimedia Commons.
Open free boosters and add Log–log plot to your collection.
Play for free