
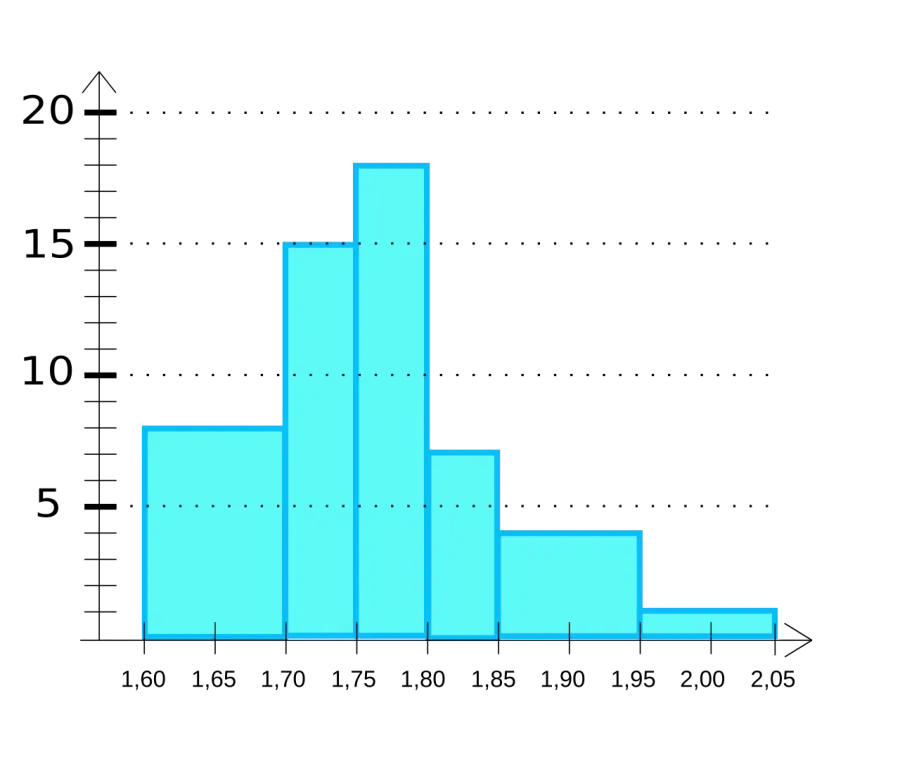
 Histogram
Rare
Rarity: Rare
A topic known well beyond its field, found in many languages.
Rarity follows how well known the article is: its views on the French and English Wikipedia over a year, and the number of languages it exists in.
At a glance
- Class
- Notion
- Domain
- Science and technology
- In collections
- 1 player has it in their collection.
What Wikipedia says
A histogram is a visual representation of the distribution of quantitative data. To construct a histogram, the first step is to "bin" (or "bucket") the range of values— divide the entire range of values into a series of intervals—and then count how many values fall into each interval.
Excerpt from the Wikipedia article “Histogram”, under the CC BY-SA 4.0 license. Read the article on Wikipedia
Image: No machine-readable author provided. Romary assumed (based on copyright claims)., CC BY 2.5, via Wikimedia Commons.
Open free boosters and add Histogram to your collection.
Play for free