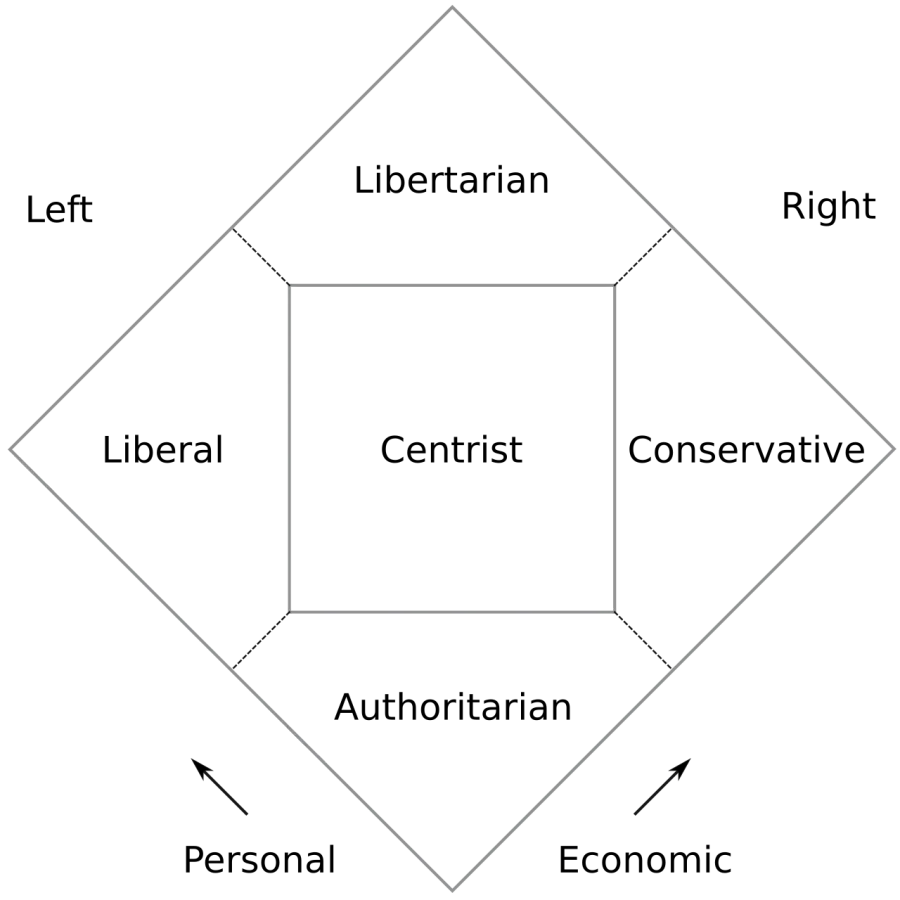
 Nolan chart
Uncommon
Rarity: Uncommon
A topic a little better known than average, read and translated beyond its own country.
Rarity follows how well known the article is: its views on the French and English Wikipedia over a year, and the number of languages it exists in.
At a glance
- Class
- Notion
- Domain
- Science and technology
- In collections
- Nobody has pulled it yet.
What Wikipedia says
The Nolan chart is a political spectrum diagram created by American libertarian activist David Nolan in 1969, charting political views along two axes, representing economic freedom and personal freedom.
Excerpt from the Wikipedia article “Nolan chart”, under the CC BY-SA 4.0 license. Read the article on Wikipedia
Image: "Proud User"/SVG: User:Universalamateur, CC0, via Wikimedia Commons.
Open free boosters and add Nolan chart to your collection.
Play for free