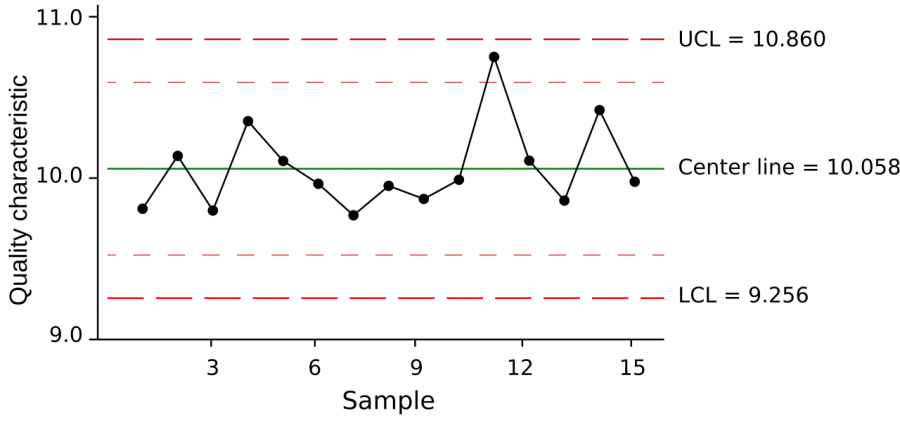
 Control chart
Uncommon
Rarity: Uncommon
A topic a little better known than average, read and translated beyond its own country.
Rarity follows how well known the article is: its views on the French and English Wikipedia over a year, and the number of languages it exists in.
At a glance
- Class
- Notion
- Domain
- Science and technology
- In collections
- Nobody has pulled it yet.
What Wikipedia says
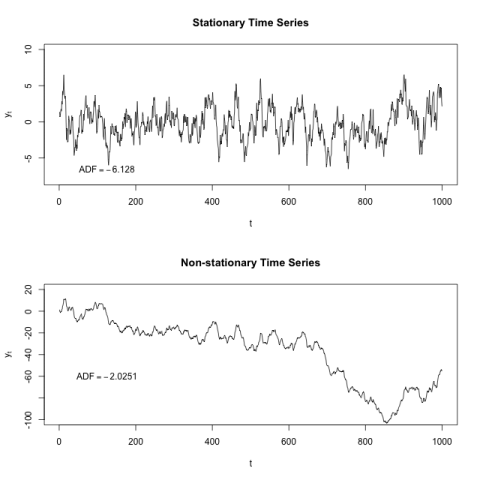
Control charts (also known as Shewhart charts, after Walter A. Shewhart, or process-behavior charts) are graphical plots used in statistical process control (SPC) to determine whether a manufacturing or business process is in a state of statistical control.
Excerpt from the Wikipedia article “Control chart”, under the CC BY-SA 4.0 license. Read the article on Wikipedia
Image: Original uploader was DanielPenfield at en.wikipedia, Public domain, via Wikimedia Commons.
Open free boosters and add Control chart to your collection.
Play for free