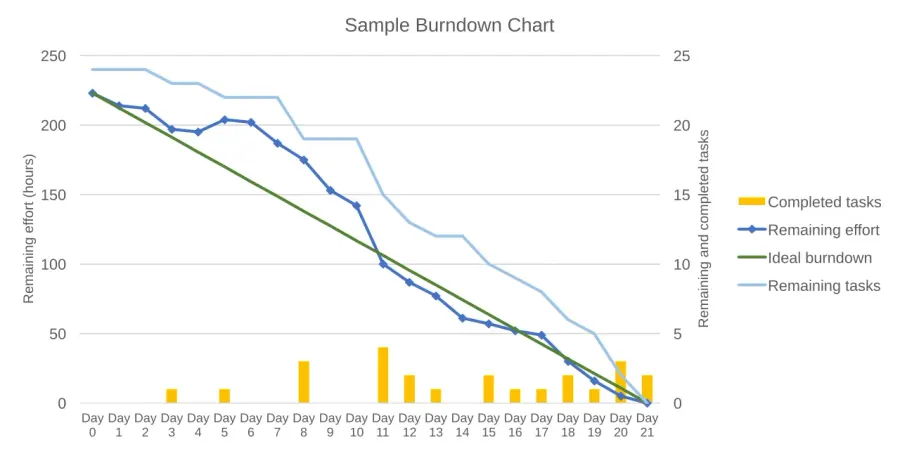
 Burndown chart
Common
Rarity: Common
The most frequent rarity: most Wikipedia articles become Commons.
Rarity follows how well known the article is: its views on the French and English Wikipedia over a year, and the number of languages it exists in.
At a glance
- Class
- Invention
- Domain
- Science and technology
- Knowledge cost
- 2
- In collections
- Nobody has pulled it yet.
What Wikipedia says
A burndown chart or burn-down chart is a graphical representation of work left to do versus time. The outstanding work (or backlog) is often on the vertical axis, with time along the horizontal. A burndown chart is a run chart of remaining work. It is useful for predicting when all of the work will be completed.
Excerpt from the Wikipedia article “Burndown chart”, under the CC BY-SA 4.0 license. Read the article on Wikipedia
Image: PabloStraub, CC0, via Wikimedia Commons.
Open free boosters and add Burndown chart to your collection.
Play for free